|
||
|
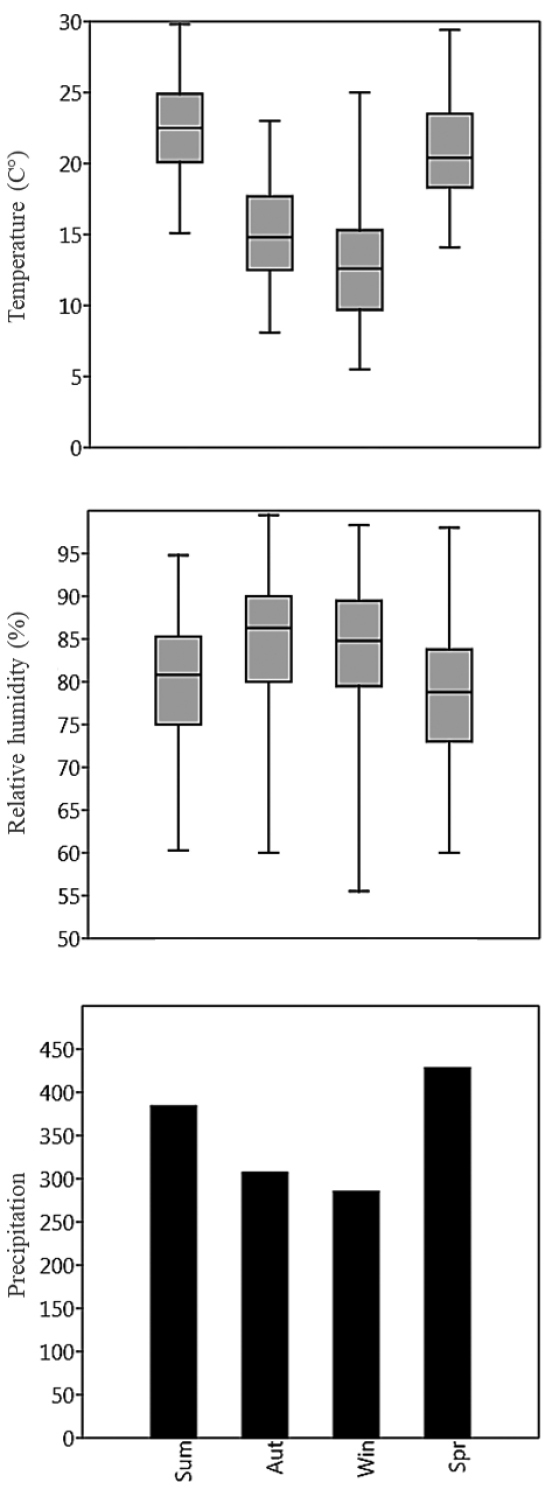
Average A: mean daily temperature (°C), B: cumulative precipitation (mm) and C: relative humidity (%) of the seasons during the study (spring (Spr): October to December, summer (Sum): January to March, autumn (Aut): April to June, and winter (Win): July to September). In the box plots, the boundary of the gray box indicates the 50% central percentile, the black line within the box marks the median, and the whiskers above and below the box indicate the lower and higher 25% percentiles. |