|
||
|
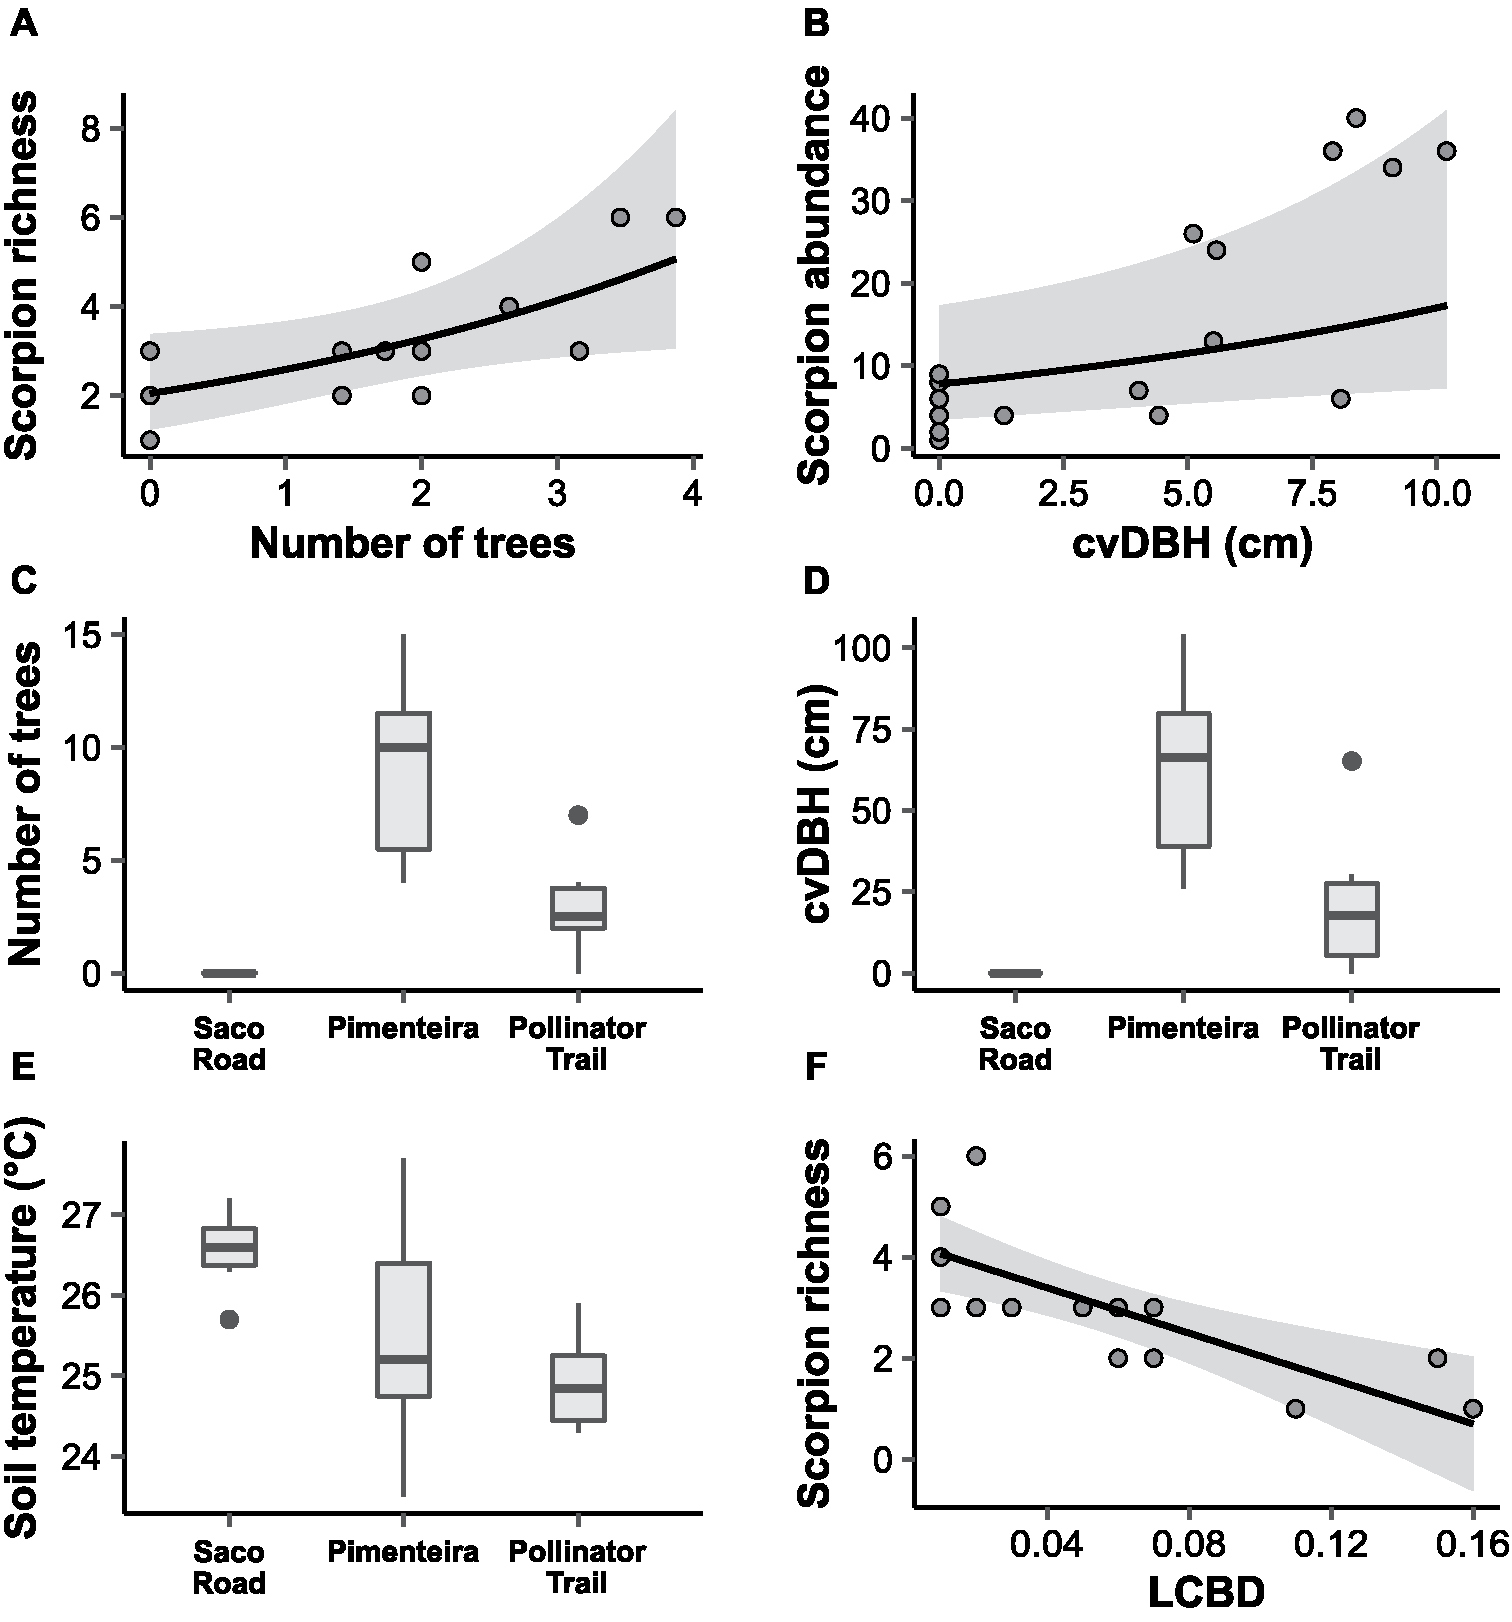
Effect plot depicting the relationship between scorpion richness and the number of trees (A) and scorpion abundance with the DBH of trees measured at Pimenteira, Saco Road and the Pollinator Trail (Pernambuco, Brazil) (B); grey shades represent the 95% confidence intervals around the predictor values obtained from the generalised linear mixed-effects models. Numerical differences in the number (C) and DBH of trees (D) amongst sampling localities are also presented. Species composition varies as a function of temperature differences (see Results) and the thermal profile of each sampling site is summarised in boxplot panel (E). The linear relationship between species richness and local contribution to β-diversity is illustrated by the output of a Pearson correlation (F), in which the 95% confidence interval is represented by the grey shade. |