|
||
|
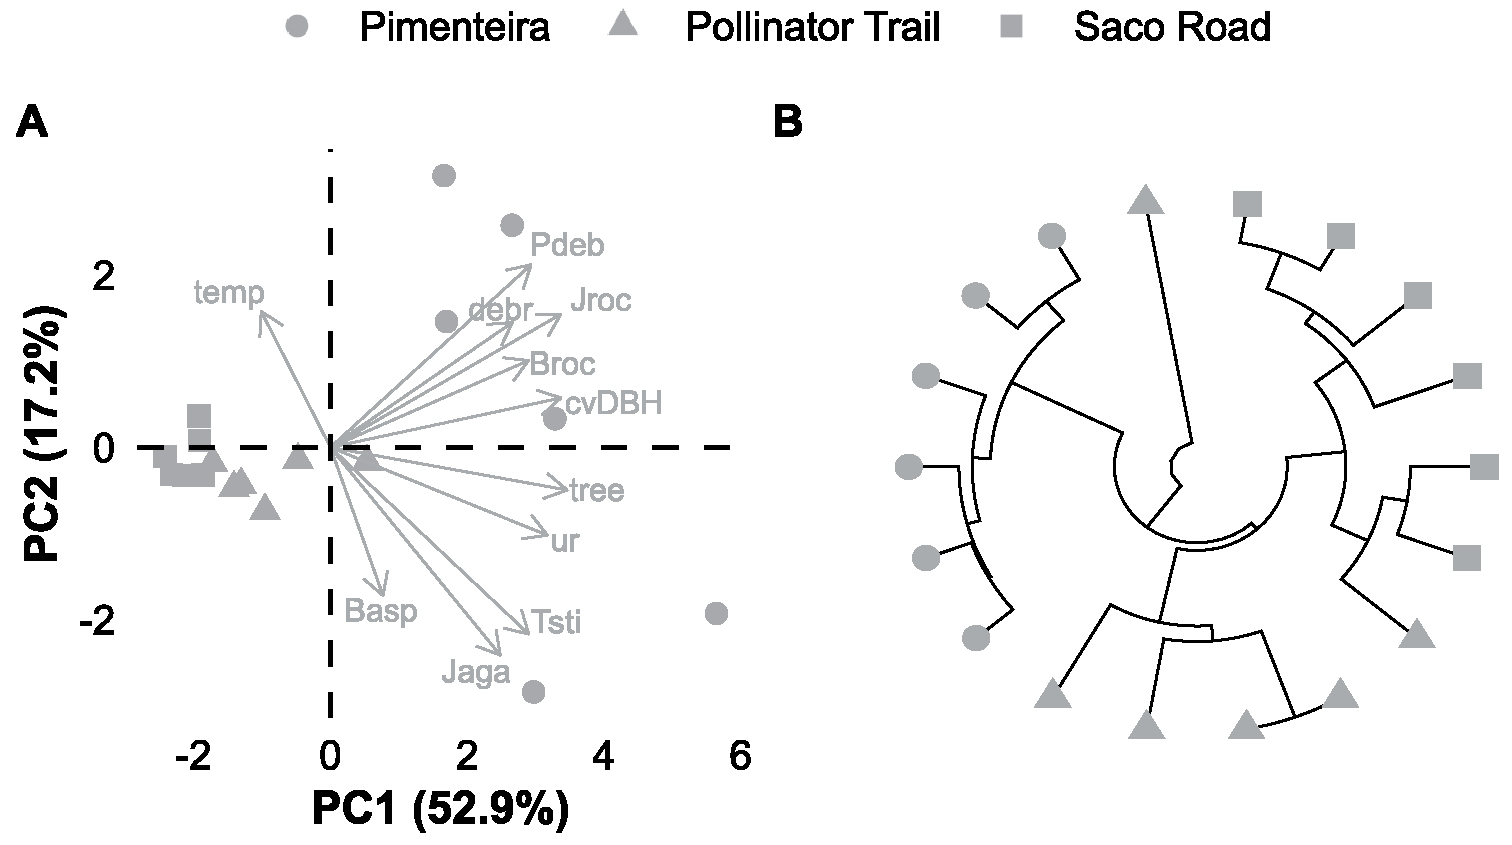
Correlation structures amongst species abundance and environmental predictors measured at Pimenteira, Saco Road and the Pollinator Trail (Pernambuco, Brazil), as summarised by two PCA axes that account for 70.1% of the total variation within the dataset (A). Environmental predictors are temperature (temp), relative humidity of the soil (ur), amount of debris (debr), number of trees (trees) and the coefficient of variation of their diameter at breast height (cvDBH); species abbreviation can be interpreted from Table 1. UPGMA topology depicting the similarity pattern amongst transects (tips) of each sampling locality (point symbols) obtained from the computation of quantitative Sørensen’s dissimilarity index (B). |