|
||
|
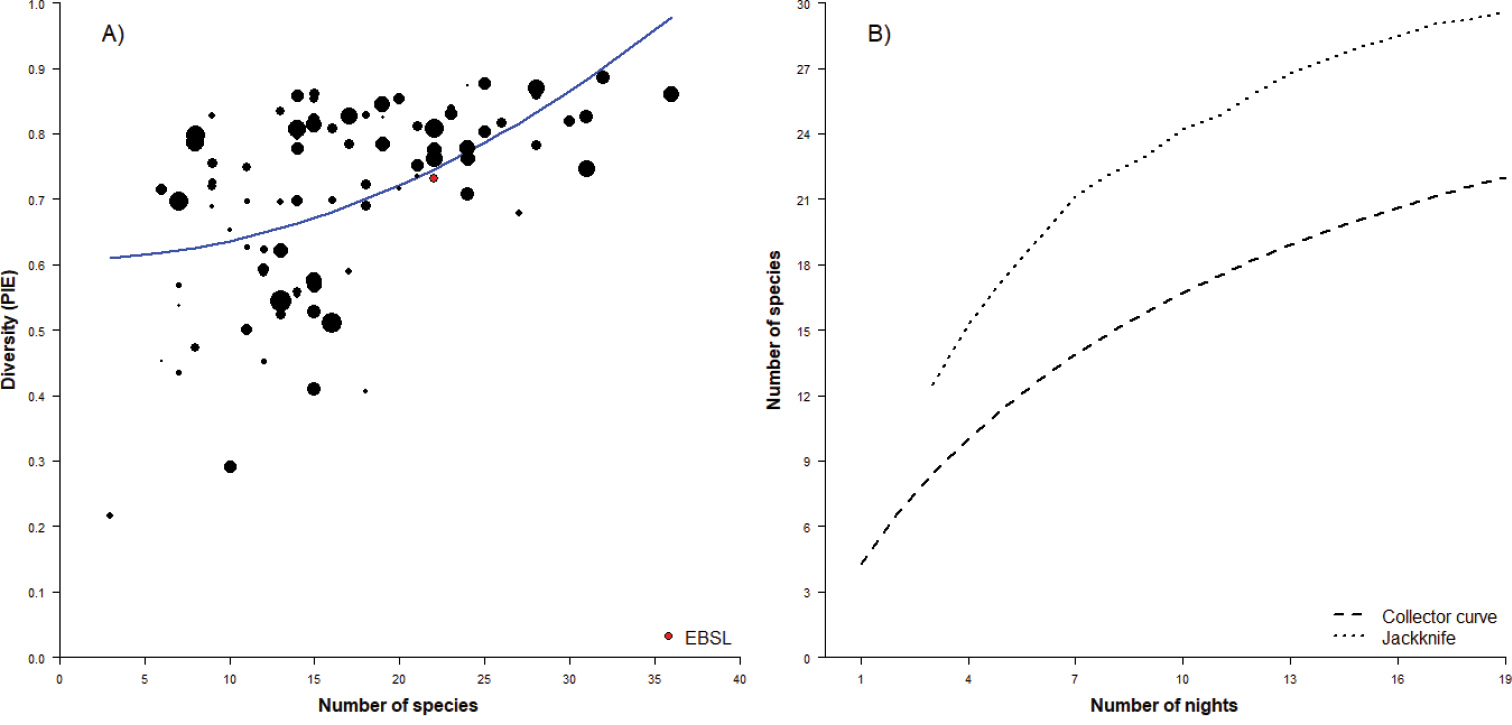
Bat assemblages in an area of Atlantic Forest, southeastern Brazil. A. Species richness and PIE values from 90 inventories of bats. EBSL is highlighted by the red dot. Area of the locality is represented by the dot size. Blue line depicts a fitted model of expected PIE values due to species richness. See Suppl. material 1: Table S1 for details. B. Species accumulation curves based on first-order Jackknife richness estimator. Dashed line are the accumulated average number of species, after randomizations, and dotted line depicts the number of species estimated by Jackknife. |